World Trade Statistics (WITS) API in Python

Build Status codecov.io Language grade: Python Pypi pyversions Jupyter Notebook GitHub.io Star

This package is an implementation of the World Integrated Trade Solution API. Use this package to explore the Trade and Tariff Data published by the World Bank.

This python package itself is licenced under the MIT License. Different Terms and Conditions apply to the WITS data itself, please read the Frequently Asked Questions on the WITS website.

Quick tutorial

Installation

Install or update the World Trade Data python package with

pip install world_trade_data --upgrade

Get the list of countries, products, indicators

See the outputs of the commands below on GitHub. Or even, open this README.md as a notebook and run it interactively on Binder!

In [1]:
import pandas as pd
import world_trade_data as wits
pd.set_option('display.max_rows', 6)
In [2]:
wits.get_countries()
Out[2]:
name notes countrycode isreporter ispartner isgroup grouptype
iso3Code
AFG Afghanistan 004 False False No N/A
ALB Albania 008 False False No N/A
DZA Algeria 012 False False No N/A
... ... ... ... ... ... ... ...
YUG Yugoslavia,FR(Serbia/Montenegr 890 True False No N/A
ZMB Zambia 894 False False No N/A
ZWE Zimbabwe 716 False False No N/A

266 rows × 7 columns

In [3]:
wits.get_products()
Out[3]:
isgroup nomenclaturecode grouptype productdescription notes
productcode
999999 N/A N/A N/A Not Applicable
01-05_Animal Yes H0 Sector Animal
06-15_Vegetable Yes H0 Sector Vegetable
... ... ... ... ... ...
UNCTAD-SoP2 Yes H0 Stages-Of-Processing Intermediate goods
UNCTAD-SoP3 Yes H0 Stages-Of-Processing Consumer goods
UNCTAD-SoP4 Yes H0 Stages-Of-Processing Capital goods

31 rows × 5 columns

In [4]:
wits.get_indicators()
Out[4]:
ispartnerequired SDMX_partnervalue isproductrequired SDMX_productvalue name definition source topic productclassification periodicity valuation currency notes
indicatorcode
CNTRY-GRWTH yes yes Country Growth (%) Annual percentage growth rate of the country’s... WITS - UNSD Comtrade Trade Harmonized System 1988/92, SITC Revision 2 Annual Export - FOB; Import - CIF None 1) Mirror Exports is considered 2)Growth for a...
HH-MKT-CNCNTRTN-NDX no 999 no 999999 HH Market concentration index Hirschman Herfindahl index is a measure of th... WITS - UNSD Comtrade Trade Harmonized System 1988/92, SITC Revision 2 Annual Export - FOB; Import - CIF None 1) Mirror Exports is considered for export dat...
MPRT-PRDCT-SHR yes yes Product Share (%) The share of total merchandise trade (export o... WITS - UNSD Comtrade Trade Harmonized System 1988/92, SITC Revision 2 Annual None None
... ... ... ... ... ... ... ... ... ... ... ... ... ...
XPRT-PRTNR-SHR yes no 999999 Partner Share (%) The share of total merchandise trade (export o... WITS - UNSD Comtrade Trade Harmonized System 1988/92, SITC Revision 2 Annual None None
XPRT-SHR-TTL-PRDCT yes yes Share in Total Products (%) Share in Total Products (%) WITS - UNSD Comtrade Trade Harmonized System 1988/92, SITC Revision 2 Annual None None 1) All traded products at HS 6 digits are con...
XPRT-TRD-VL yes yes Trade Value (US$ Thousand) Total Import/Export Value in thousands of US D... WITS - UNSD Comtrade Trade Harmonized System 1988/92, SITC Revision 2 Annual Export - FOB; Import - CIF US Dollar - Current value

20 rows × 13 columns

All these methods accept a datasource argument, which can be any of

In [5]:
wits.DATASOURCES
Out[5]:
['trn', 'tradestats-trade', 'tradestats-tariff']

The nomenclature, and data availability, are accessible with get_nomenclatures() and get_dataavailability().

Get the Trade or Tariff data

Indicators are available with get_indicator. Tariff rates can be loaded with get_tariff_reported and get_tariff_estimated.

Sample use case

In the below we show how to collect and plot the Import and Export data for the USA in 2017.
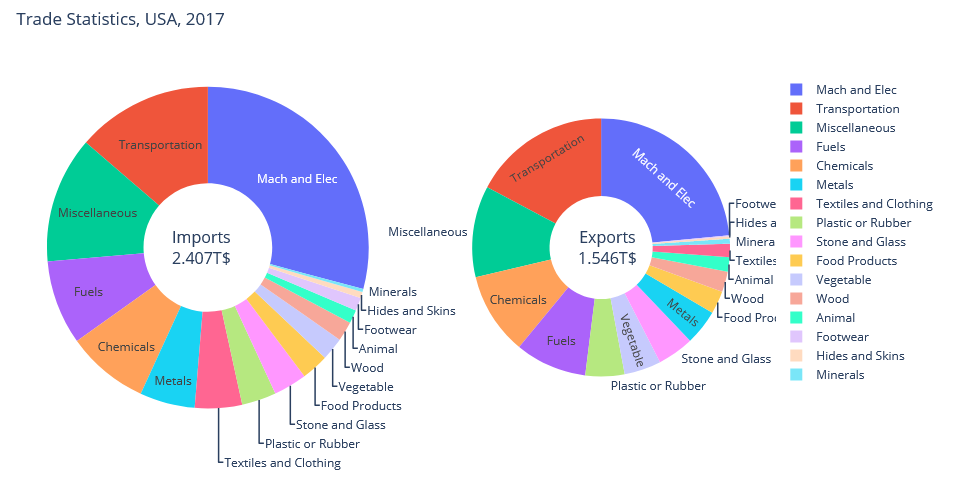
To begin with, we request the values for the corresponding import and exports. Here, we use the default value for partner='wld', and the default value for product='all'.

In [6]:
usa_imports_2017 = wits.get_indicator('MPRT-TRD-VL', reporter='usa', year='2017')
usa_exports_2017 = wits.get_indicator('XPRT-TRD-VL', reporter='usa', year='2017')
In [7]:
usa_imports_2017
Out[7]:
Value DataSource
Freq Reporter Partner ProductCode Indicator Year
Annual United States World Animal Import Trade Value (US$ Thousand) 2017 3.232023e+07 WITS - UNSD Comtrade
Vegetable Import Trade Value (US$ Thousand) 2017 5.544372e+07 WITS - UNSD Comtrade
Food Products Import Trade Value (US$ Thousand) 2017 6.589701e+07 WITS - UNSD Comtrade
... ... ... ... ...
Intermediate goods Import Trade Value (US$ Thousand) 2017 3.567230e+08 WITS - UNSD Comtrade
Consumer goods Import Trade Value (US$ Thousand) 2017 8.859291e+08 WITS - UNSD Comtrade
Capital goods Import Trade Value (US$ Thousand) 2017 8.370583e+08 WITS - UNSD Comtrade

29 rows × 2 columns

Now we remove the first levels of the index

In [8]:
usa_imports_2017 = usa_imports_2017.loc['Annual'].loc['United States'].loc['World']
usa_exports_2017 = usa_exports_2017.loc['Annual'].loc['United States'].loc['World']

Note that one line in the table gives the value for imports on all products:

In [9]:
usa_imports_2017.loc['All Products']
Out[9]:
Value DataSource
Indicator Year
Import Trade Value (US$ Thousand) 2017 2.407390e+09 WITS - UNSD Comtrade

In order to avoid double counting, we only look at sectors:

In [10]:
products = wits.get_products()
sectors = products.loc[(products.grouptype=='Sector') & (products.index!='Total')].productdescription.values
sectors
Out[10]:
array(['Animal', 'Vegetable', 'Food Products', 'Minerals', 'Fuels',
       'Chemicals', 'Plastic or Rubber', 'Hides and Skins', 'Wood',
       'Textiles and Clothing', 'Footwear', 'Stone and Glass', 'Metals',
       'Mach and Elec', 'Transportation', 'Miscellaneous'], dtype=object)

and make sure that we reproduce well the total:

In [11]:
assert pd.np.isclose(usa_imports_2017.loc[sectors].Value.sum(), usa_imports_2017.loc['All Products'].Value)

Finally we represent the data using e.g. Plotly's Pie Charts

In [12]:
import plotly.graph_objects as go
from plotly.subplots import make_subplots

imports_musd = usa_imports_2017.loc[sectors].Value / 1e3
exports_musd = usa_exports_2017.loc[sectors].Value / 1e3

fig = make_subplots(rows=1, cols=2, specs=[[{'type':'domain'}, {'type':'domain'}]])
fig.add_trace(go.Pie(labels=sectors, values=imports_musd, name="Imports"), 1, 1)
fig.add_trace(go.Pie(labels=sectors, values=exports_musd, name="Exports"), 1, 2)

fig.update_traces(hole=.4, 
                  scalegroup='usa',
                  textinfo='label',
                  hovertemplate = "%{label}<br>%{value:,.0f}M$<br>%{percent}")

fig.update_layout(
    title_text="Trade Statistics, USA, 2017",
    annotations=[dict(text='Imports<br>{:.3f}T$'.format(imports_musd.sum()/1e6),
                      x=0.17, y=0.5, font_size=16, showarrow=False),
                 dict(text='Exports<br>{:.3f}T$'.format(exports_musd.sum()/1e6),
                      x=0.83, y=0.5, font_size=16, showarrow=False)])
fig.show(renderer='notebook_connected')

References & Alternatives

  • The official WITS portal let you visualize and download trade and tariff data. And the API implemented in this package is documented here.
  • The WITS data can be accessed in R with the tradestatistics library.
  • An alternative way to access the WITS data is to use pandasdmx.